2 Methodology
2.1 Scope: What to expect from the CRM
The Monitor differs from other multi-dimensional risk databases in that it compiles real-time and forward-looking risk information, together with static descriptions of historical vulnerability to compound risk. In so doing, the CRM aims to complement existing risk tracking systems (by focusing on potential compounding effects) rather than replace them. In designing the Monitor, the team focused on ensuring a careful balance between complexity (in beginning to explore the interactions between different dimensions of compound risk) and simplicity (in ensuring the outputs of the Monitor are intuitive enough to support decision-makers). See box 2 for a short description of the design principles that guided the development of the CRM. The Monitor and its methodology are therefore a live resource, open to continuous updates and refinement as new data sources become available and based on feedback from both technical experts and potential users (see Section 2.3).
Before delving into the methodology used in compiling the CRM, it is important to clarify how the tool should (and should not) be used.
What the Monitor DOES:
It provides a global overview of country-level compound risk. The CRM does so by drawing on the best available sources of risk information across a range of dimensions of compound risk (six in total) to provide high-level risk summaries for both underlying vulnerability and emerging threats, as well as providing overall alert flags. In addition, the tool aims to encourage decision makers to look at risks holistically – providing multidimensional risk information to actors that might otherwise focus on singular risk factors.
It acts as a simple alert system, flagging any areas of potential concern that display strong signals and that therefore warrant increased vigilance. Using the default method, flags are raised whenever one (or more) indicator within a given dimension has exceeded a high-risk threshold. This means that the CRM is inherently proactive – a flag will be raised even in instances where all other indicators within the dimension are not considered high risk. For this reason, users are encouraged to consider and probe the diversity of indicators scores – doing so will be facilitated through use of an interactive dashboard that accompanies it.
What the Monitor is NOT intended for:
It is NOT a modelling exercise. Nor is it an attempt at precisely projecting the severity of compound risk. The Monitor highlights countries and regions where concerns exist relating to one or (or multiple) dimensions. In this way, the CRM is designed as a flagging system. This differs from systems aimed at precisely quantifying the timing and magnitude of future risks. Decision-makers should see the CRM as a high-level guidance tool, to be complemented by supplemental and more in-depth risk analytics to inform specific policy and operational decisions. For example, the CRM cannot substitute a detailed sub-national risk profile or a probabilistic model that quantifies the likely magnitude and frequency of natural hazards in a given country over different time periods.
It is NOT designed with the aim of ranking countries. Given its reliance on a flagging system, like-for-like rankings of countries within the CRM is not considered appropriate. Instead, users should prioritize use of the tool to observe how a country’s risk changes over time, as well as providing a broad overview of the geographic spread of compound risk.
It is NOT meant to replace sector-specific risk monitoring tools. The CRM collates information from a range of sector-specific risk monitoring tools. These are used as source indicators that feed into the CRM model (with high and low risk thresholds assigned to each). While the Monitor presents summarized risk profiles across all respective sectors, they are not meant to replace them. Through the dashboard, the CRM will point users to relevant sector-specific risk tools and data repositories for further insights.
It is NOT a complete measure of compound risk. Risk is decidedly multi-dimensional. Capturing and quantifying all possible risks that a country faces is an impossible task. Instead, the CRM focuses on six distinct dimensions of compound risk. These are used as lenses through which levels of risk facing a given country are inferred. Future work on the CRM will focus on quantifying precise interactions and weights between these dimensions and may explore the integration of additional dimensions.
Box 2: Design principles
The design of the CRM was guided by four key design principles:
- Simplicity. Given the large number of data sources underlying the CRM, simplicity is paramount to ensure that risk information is easy to communicate and interpret. Users should be able to quickly identify the main dimensions that are contributing to a country’s level of compound risk. The planned user interface, in the form of a web-based interactive dashboard, will give users access toa wide variety of descriptive information and visualizations.
- Flexibility. The CRM has a range of potential users, each with their own informational needs. Accordingly, many aspects of the Monitor are designed so as to be easily tailored to users’ needs. One example is the choice of high/low thresholds used for classifying indicators and risk dimensions. In addition, users may want to place higher emphasis on particular dimensions, or isolate upcoming threats that may be of interest.
- Disaggregating risk information across time-periods. Decision-makers often require information related to a range of timescales, ranging from historical trends to long-term projections of future risk. With this in mind, the Monitor is designed in a way that intuitively showcases levels of compound risk related to a range of time-periods of interest.
- Building on existing multidimensional risk indices. Whenever possible, the CRM builds on existing risk monitoring initiatives, aligning dimensions, indicators and aggregation methods where appropriate and adding new dimensions that suit the needs and purpose of the CRM. In particular, most multi-dimensional risk indices provide static snapshots of existing (or systemic risk). The CRM adds notable value in combining these with indicators that reflect real-time and forward-looking indicators to provide an outlook on emerging threats conditions. Furthermore, it combines information from underlying vulnerability and emerging threats to provide a gauge of overall alertness needed in responding to given risk dimensions.
Development and interpretation of any risk monitoring system requires an understanding of the considerable technical challenges involved in tracking risk. In particular, there are two main methodological challenges that affect the design of the Compound Risk Monitor:
First and foremost, data availability. Risk is inherently multi-dimensional, with no one indicator able to holistically cover all aspects of risk. With this in mind, the CRM draws on a range of existing indices that aggregate large pools of indicators across different risk dimensions and dimensions. Inevitably, not all sources of underlying data offer the same level of robustness and some components are inherently better at comprehensively reflecting local risk conditions than others. For example, while there is a relative abundance of real-time information on exposure to natural hazards and occurrence of conflict events, few resources exist to track household-level socio-economic vulnerability. In addition, risk information is geographically patchy, with few data sources providing full global coverage. The CRM therefore aggregates information from a range of data sources. This often means that the reliability of respective dimensions of compound risk used in the CRM will vary at different spatial scales, requiring careful interpretation of the underlying metrics that feed into it. For example, FEWSNET provides a comprehensive assessments of food security conditions in the 30 countries it covers. Yet, outside of this, analysts are typically reliant on alternative proxies to assess real-time conditions, many of which are far less reliable.
Lastly, different methods for data aggregation can result in vastly different risk outcomes. Given that tracking of compound risk requires multiple sources of information, choice of how to combine and weight different indicators is paramount. This applies not only to how individual dimensions are represented, but interactions between them. For example, deciding whether certain groupings of dimensions (e.g. conflict, macro-fiscal dynamics and food security) should be weighted differently to others (e.g. COVID and natural hazards) requires judgement calls in the absence of robust evidence. This is particularly relevant for any attempts at modelling or predicting compound risk (a task the CRM does not attempt to do).
In addition to these challenges, it is important to recognize that while representing factors associated with a single risk dimension (e.g. natural hazard risk) comes with a degree of uncertainty, uncertainties in compound risk are inherently much higher. This owes not only to the fact that uncertainties will additively accumulate as individual dimensions are combined in the CRM. It also recognizes that little is currently known about how risk factors amplify/diminish when compounded. Care therefore needs to be taken in communicating outputs from any multi-dimensional risk monitoring system – with clear guidance on scope of the tool.
2.2 Unpacking compound risk in the CRM
There currently is no standard definition of compound risk (Pescaroli and Alexander 2018) and the term is frequently used synonymously with concepts such as ‘cascading’, ‘complex’ or ‘multi-dimensional’ risk. At its most basic, compound risk results from ‘the combination of two or more events’ (IPCC 2012). It refers to the types of situations where a single hazard interacts with underlying vulnerabilities and in turn influences the extent and impact of secondary or tertiary hazards (Cutter 2018). A recent paper by Zscheischler et al.3 offer a useful typology of compound risks, anchored in climate science. Compound risks include: i) the occurrence of multiple threats (either the same or different types of threats) in quick succession; ii) the occurrence of multiple threats in close geographic proximity; and iii) rapid increases in vulnerability leading to heightened sensitivity to future threats (including threats that would otherwise not lead to a crisis).
Compound risk is therefore not only a function of exposure to multiple hazards, but also of the underlying vulnerabilities of the people and communities affected by them. For example, socio-economic vulnerability is often considered an outcome of compounding risk – perhaps a result of two back-to-back cyclones affecting an area. Yet, a sharp increase in poverty can also generate compounding effects by severely weakening household-level capacities to cope with even minor shocks and stressors that would otherwise not lead to major impacts/crises.
The CRM breaks down compound risk into underlying dimensions, each representing risk conditions, threats or vulnerabilities that have the potential to contribute to compound risk. There is no standard framework for compound risk across the risk literature or other risk monitoring initiatives.4 The CRM team therefore focused on: i) dimensions that are commonly referred to across a range of similar risk monitoring initiatives; ii) dimensions that are relevant to the Bank’s mandate and operational interests as highlighted in the 2018 GCRP Board paper; and iii) dimensions for which there is sufficient data availability in tracking changing risk conditions.
Based on these criteria, the CRM separates compound risk into six core dimensions: i) natural hazards, ii) food security, iii) conflict and fragility, iv) macro-fiscal dynamics, vi) socio-economic vulnerability, and vii) health risks5. While each is considered distinct, there are inherently strong overlaps across the six dimensions. Indeed, each individual dimension is multi-dimensional in nature, with some degree of inevitable overlap across other dimensions. While this would complicate any attempt to model compound risk as part of a single composite index, the fact that the CRM is based on a flagging system is intended to avert concerns associated with such interactions.
Below we provide further insight into the rationale and scope of the various dimensions underlying the CRM. For a full list of the indicators that feature under each component refer to Section 2.3, Step 1 below.
Figure 1: Breaking compound risk into six dimensions
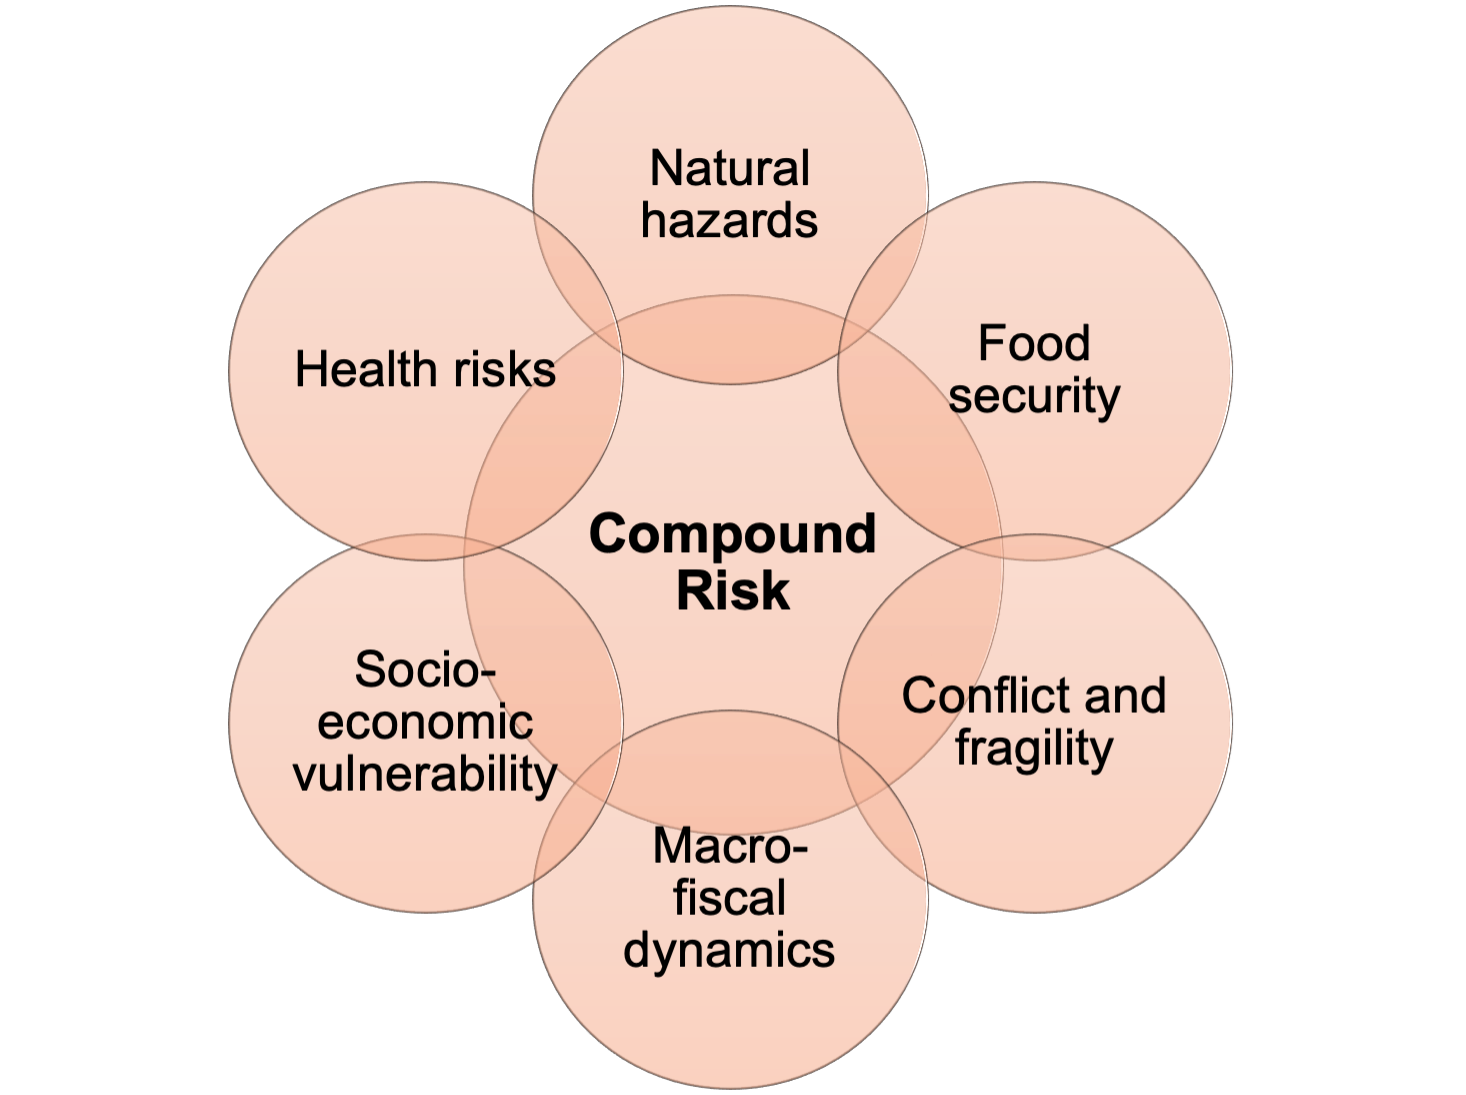
Note: The graphic above highlights the conceptual overlap between the six dimensions of compound risk selected and overall compound risk. In reality, there are more overlaps across individual dimensions.
Natural hazards: Natural hazards are perhaps the threat most typically associated with compound risk. They also feature prominently as core dimensions in a wide range of risk monitoring efforts, including INFORM, ND-GAIN and FAO/WFP’s Early Warning Analysis. There are many examples of back-to-back (or overlapping) hazards that have resulted in complex crisis. The short span between cyclones Kenneth and Idai in Mozambique (2019) and the more recent successive occurrence of hurricanes Eta and Iota in Nicaragua (2020) are good examples of the devastation that natural hazards can inflict on societies and economies. In the context of the CRM, we categorize natural hazards across climate-related events such as floods, droughts and cyclones; geophysical events such as earthquakes and tsunamis; as well as pest-related events such as the locust outbreak currently affecting the Horn of Africa.
Food security: As highlighted above, the CRM defines compound risk in relation to the interaction of both hazards and underlying vulnerabilities. In this sense, while food insecurity can often result as consequence of specific threats (such as natural hazards or conflict), high levels of food insecurity can significantly increase a community’s sensitivity and vulnerability to other compounding threats. Food insecurity within the CRM is defined as contexts where people do not have adequate physical, social or economic access to food. This holistic definition recognizes that there is no single metric of food insecurity, and rather demands multi-dimensional measures covering all aspects related to access to sufficient amounts of safe and nutritious food. Food security also features as a core dimension of both the ND-GAIN, FAO/WFP EWA.
Conflict and fragility: Fragile and conflict-affected states are among the contexts with the highest potential for compound risk. In particular, coping capacity is often limited, with weakened country systems unable to respond to shocks, exacerbating impacts on lives and livelihoods. The CRM considers both violent conflict – reflecting widespread and intense violence across many parts of the country, as well as institutional fragility – reflecting countries facing deep institutional crises, that have very poor transparency and government accountability, or that have weak institutional capacity. The CRM’s definition of conflict and fragility mirrors the World Bank’s classification of fragile and conflict-affected situations.6
Macro-fiscal: Economic shocks (and a country’s fiscal response) can have large impacts on a country’s capacity to deal with future risk as well as its development trajectory. In the context of the CRM, the macro-financial and fiscal risk dimension refers to the general status of a country’s economy and the sustainability of fiscal measures adopted. It focuses on aspects related to public sector, corporate, monetary, debt sustainability, banking and market-related risks.7 Given the lack of suitable preexisting metrics for tracking underlying vulnerability and emerging threats related to macro-fiscal risk, the CRM will opt for a phased approach. The macro-fiscal dynamics dimension will first be based on a modified version of the EIU Risk Briefing score (further details on the proposed steps are outlined in Figure 1). As a second step, the CRM team will seek to replace (or complement) inputs from the EIU with an in-house metric design in collaboration with a variety of Bank units (including CROCR, MTI, FCI and Prospects). See Annex X for further details on the proposed index.
Socio-economic vulnerability: The inclusion of socio-economic vulnerability in the CRM recognizes that compound risk arises from the interactions of hazards and underlying vulnerabilities. Indeed, a compound event can occur precisely because a community has experienced a rapid deterioration in livelihood outcomes and/or coping capacity – meaning that the ability to deal with emerging threats is severely compromised (even for threats that would otherwise not lead to crisis). To complement use of macro-level inputs, the CRM also monitors socio-economic vulnerability, leveraging the World Bank’s unique sources of real-time data on household-level dynamics – including poverty projections, inequality level estimates and remote phone-surveys.8
Health-systems, disease outbreaks and response (‘Health risk’ hereafter): The ongoing COVID pandemic is a prime example of the potentially devastating impacts of disease outbreaks on economies and societies. With this in mind, the CRM features a measure of: i) the effectiveness of a country’s healthcare system; ii) exposure to ongoing (or potential) health-related threats, namely epidemics and pandemics; and iii) the immediate implications of response options (or lack thereof) on a country’s ability to contain an ongoing threat.
The CRM is designed to allow some degree of flexibility and the remit of each dimension (and composition of indicators within each) may therefore change gradually over time as the nature of the global risk landscape continues to evolve. For example, the current emphasis on COVID-19 and its secondary impacts is likely to be reassesses over time as the pandemic evolves. To guide this process, the team plans to review the scope of each dimension (and indicators) quarterly, seeking inputs from relevant experts across the institution.
2.3 Risk outlooks within the CRM
Levels of compound risk can be looked at in many different ways depending on the interests and needs of intended users. For example, users may be primarily interested in knowing whether a given set of countries is predisposed to compound risks based on historical trends and underlying response capacities. Others may be more interested in understanding the extent to which a given country is experiencing changing risk conditions, based on recent or expected trends. Lastly, some users may wish to take both of these sources of information into account to understand how recent changes in risk conditions are likely to impact on a country’s overall levels of compound risk in the near future.
Recognizing the diversity of user needs, the CRM produces three distinct types of risk outlook: underlying vulnerability, emerging threats and overall compound risk.
Underlying vulnerability is a measure of a county’s predisposition to the occurrence and impacts of compound crises based on historical trends and underlying coping capacities. It can be thought of as a measure of systemic vulnerability, using static indicators to quantify levels of risk across all six dimensions used in the CRM. The majority of data sources come from multi-dimensional risk indices that combine elements of exposure, sensitivity and response capacity to given threats. Most inputs to the CRM are updated on an annual basis (e.g. the EU’s INFORM risk index, WFP’s Proteus index or the EIU’s Global Health Score index)9, and hence considered static given the low frequency of updates.
Use-case: Most relevant to decision makers seeking a holistic assessment of compound risk hotspots based on historical trends and underlying capacities.
Strengths: Comprised of comprehensive multi-dimensional indexes and well-established thresholds; an adequate gauge of systemic vulnerability to compound crises.
Limitations: Does not take into account latest trends and changes in underlying risk capacities (e.g. the status and nature of COVID impacts).
Emerging threats provides a near real-time assessment of recent or expected changes in a country’s risk profile. It uses dynamic indicators that reflect a country’s immediate status or provide an outlook on the near-to-medium term future (i.e. up to 12 months ahead). Data is similarly sourced from a range of internal and external risk monitoring initiatives that provide regular updates on changes in risk profiles (such as FEWSNET, ACLED and regional meteorological forecasts).10 Where possible, emerging threats indicators are chosen to align with those used in determining underlying vulnerability. It is worth noting that, ideally, emerging compound risk would be further disaggregated into immediate (up to 3 months), short-term (up to 12 months) and medium-to-long-term (up to 3–5 years) risk outlooks. However, data limitations mean that this first iteration of the CRM will group future risks together. Going forward, the team will work to further refine the forward-looking timescales of the CRM.
Use-case: Useful in gauging ongoing (or likely) changes in underlying risk reconditions. Can be seen as a measure of emerging threats anomalies – countries and regions that are or are likely to experience heightened / diminished risk in the coming months. The metric is better suited to comparing regional and country-level trends, and often best placed to identify emerging threats in countries that are not traditionally considered high-risk.
Strengths: Features real-time risk information, often updated on a weekly or monthly basis; Uses a hierarchy of data inputs to balance the need for use of robust data sources alongside geographic coverage.
Limitations: Limited availability of forward-looking risk information and differences in spatial coverage of data means that care must be taken in comparing emerging and underlying vulnerability metrics as well as carrying out cross-country comparisons.
Finally, underlying vulnerability and emerging threats scores are combined to produce a measure of Overall Compound Risk. This which can be seen as a gauge of vigilance needed in responding to risk conditions in the months ahead. It is meant as an approximate indication of how significant any emerging threats are relative to a country’s underlying level of vulnerability. As a result, countries that have seen a modest increase in emerging threats, but low levels of underlying vulnerability are weighted downwards, while those that have seen slight increases in emerging threats, but high overall levels of underlying vulnerability are weighted upwards. The combined score can be a useful tool for comparisons across countries and regions, but its accuracy is undermined by the fact that underlying vulnerability and emerging threats indicators are not always directly comparable.
Use-case: Most relevant for decision makers that want a high-level assessment of overall levels of alertness related to compound risk, allowing countries to be directly compared like-for-like.
Strengths: Provides a more accurate reflection of whether recent changes in risk conditions warrant further vigilance; Consistent, simple and transparent measure; Used by a wide variety of other risk monitoring efforts; More relevant in making comparisons across regions and countries. Overall alert flags are used as the CRM’s default in presenting country level risk profiles.
Limitations: Choice of aggregation procedure can produce different results; Care needed in interpreting values as emerging threats and underlying vulnerability indicators are not always directly comparable. Assignment of threshold values is more subjective as less easily interpreted (see Annex Supplementary Text 1).
2.4 Steps in designing the CRM
While the CRM provides separate country-level assessments for underlying vulnerability and emerging threats, the same simple multi-step process is used in calculating scores for both:11
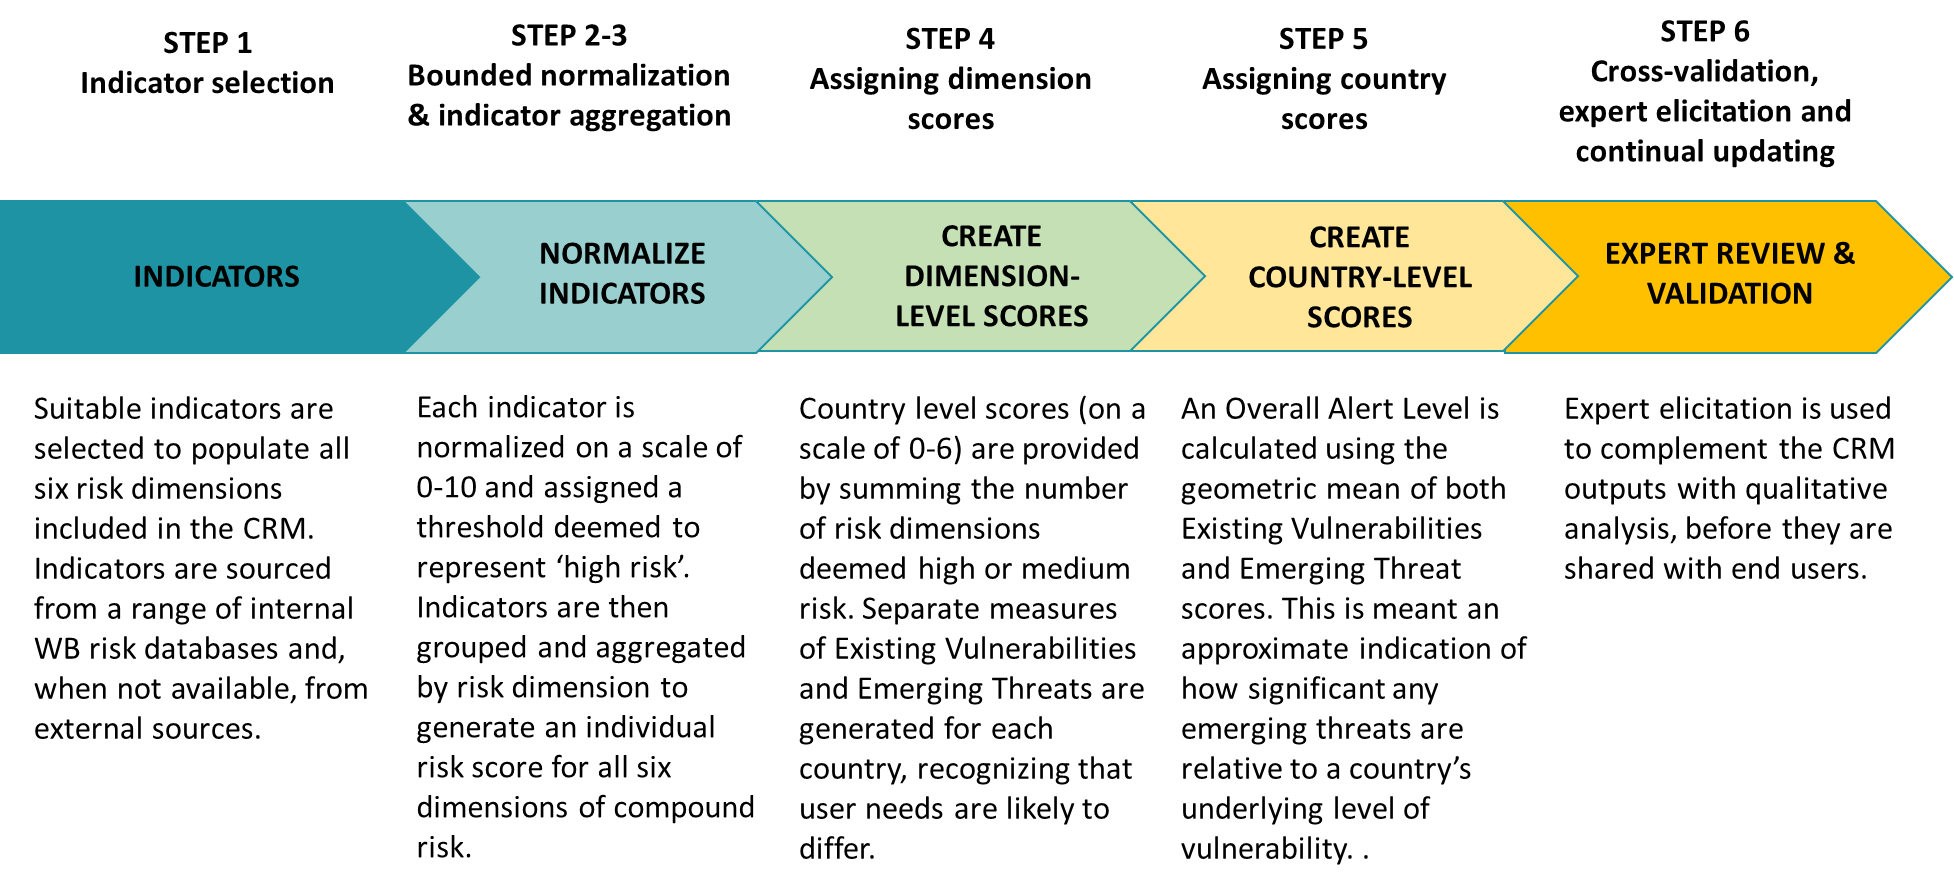
To start with, each dimension of compound risk is broken down in a series of indicators sourced from a range of internal WB risk databases and, when not available, from external sources. Indicators are grouped separately according to whether they reflect Underlying Vulnerability or Emerging Threats.
Each indicator is assigned a threshold deemed to represent ‘high risk’. A numeric score is then generated using a bounded min/max normalization procedure, with bounds assigned to upper (and in some cases lower) risk thresholds.12 Thresholds are typically assigned via expert consensus and elicitation. In cases where widely agreed thresholds are not available percentiles are used.
Next, indicators within each dimension are grouped together and aggregated. In accordance with the CRM’s flagging system, aggregation is typically done by selecting the maximum value across the suite of grouped indicators.13 In cases where there are clear differences in indicator quality, or where data has limited geographic coverage, a hierarchy of inputs is assigned. The process results in a score ranging from 0 (no risk) to 10 (high risk) for each risk dimension. Separate scores are assigned for Underlying Vulnerability and Emerging Threats.
An approximate measure of Overall Compound Risk is also generated for each risk dimension by combining inputs from the Underlying Vulnerability and Emerging Threat scores. This combined measure can be calculated using two separate approaches – which choice left to the user depending on needs and preferences. One approach is to aggregate the two source inputs using a geometric mean (similarly resulting in a score ranging from 0–10). Alert Levels are grouped into three categories with scores ranging from 7–10 deemed high alert, scores between 5–7 deemed medium alert status and scores between 0–5 considered low alert status. A second approach is to apply a filtering system across the two source inputs. This avoids the need to create a country-level score. Instead, alert levels are simply assigned when both inputs have reached a minimum level. For example, high overall compound risk for a given risk dimension is assigned when emerging threat and underlying vulnerability are similarly rated as high risk.
Country-level profiles are provided by summing the number of dimensions deemed as high (or medium) risk. Three separate measures for Underlying Vulnerability, Emerging Threats and Overall Compound Risk are provided, recognizing the diversity of user interests. Country-level scores can either be generated as the sum of risk dimensions deemed high risk or a combination of high and medium risks.14 The latter is chosen as the default for the remainder of this note.
Finally, expert elicitation is used to validate and complement the CRM outputs with qualitative analysis. The expertise and judgement of WB sectoral experts is an essential element of the overall CRM methodology, guiding indicator selection and aggregation as well as the identification of appropriate thresholds. To help manage the complexity of the analysis, we strive for methodological simplicity, but this inevitably leads to a loss of accuracy, with the risk of not capturing all areas of interest. Expert elicitation methods can help to circumvent these limitations.
Step 1: Indicator selection
To begin with, suitable indicators are selected to populate all six risk dimensions included in the CRM (with indicators grouped separately for Underlying Vulnerability and Emerging Threats). The CRM team worked with experts across key GPs to identify suitable indicators, alongside an extensive review of literature and relevant multi-dimensional risk indexes. The selection was guided by a number of factors, including: (i) whether commonly-used risk metrics already exist; ii) whether relevant indicators are already in use by WB teams; (iii) levels of geographic coverage and data quality; and (iv) frequency of updates. Whenever possible, the team sought to use existing multi-dimensional risk metrics, such as the INFORM Risk Index (see Box 3 for details). In cases where a robust multi-dimensional index is unavailable, the team identified a basket of relevant source indicators. In many cases, proxy indicators are used (particularly for emerging threats).
Box 3: Scope and overlap with the INFORM Risk index
INFORM Risk Index: The INFORM is a multi-dimensional index aimed at supporting the humanitarian sector. It is a collaboration of the Inter-Agency Standing Committee (IASC) Reference Group on Risk, Early Warning and Preparedness and the European Commission. Results are released on a bi-annual basis.
INFORM’s Risk index is split into six ‘categories’, consisting of: natural, human, socio-economic, vulnerable groups, institutional, and infrastructure. Indicators are selected to populate each of the six categories and aggregated together to form on overall composite index.
In addition to the Risk Index, INFORM has a number of satellite products that are of relevance to the CRM. In particular, the INFORM Severity index tracks the status of ongoing crises using a combination of quantitative and qualitative insights. More recently, the INFORM COVID-19 index tracks a range of real-time metrics gauging exposure and impact of the pandemic.
The CRM draws on a select range of indicators from across the Risk, Severity and COVID indexes used to populate a number of existing vulnerability dimensions – including natural hazards and socio-economic vulnerability.
For further details on INFORM’s methodology and scope see: https://drmkc.jrc.ec.europa.eu/inform-index/INFORM-Covid-19
Below we provide a brief summary of considerations in selecting key indicators used to populate the six dimensions of compound risk in the CRM (further highlighted in Table 1 below). For more details on aggregation procedures and thresholds used in each dimension of compound risk, as well as notes on suitability and alternatives see Annex Tables 1–6.
Table 1: Overview of indicators used in the CRM (see Annex Table 1–2 for details on thresholds and aggregation)
| Compound Risk Dimension | Underlying Vulnerabilities | Emerging Threats |
|---|---|---|
| Natural Hazards |
Indicator(s) used in CRM: Data hierarchy: Level 1: All source indicators are assigned Level 1 Rationale: A range of natural hazard indexes exist, providing a number of options for use in the CRM. Given the CRMs close alignment with the INFORM Risk Index – particularly for measures of underlying vulnerability – use of INFORM’s Natural Multi-Hazard Index was considered most appropriate. The index compiles exposure and vulnerability metrics on a range of hazards including earthquakes, tsunami, drought, flood and heatwaves. In addition, the CRM makes use of extensive information on exposure from the WB’s ThinkHazard! Database. Thresholds are assigned by the GCRP team in consultation with GFDRR. Alternatives considered: There are a wide range of natural hazard indexes. Prominent metrics include ND-GAIN, Global Risk Data Platform (UNEP), and the World Risk Report. However, none are considered as comprehensive as the INFORM risk, which is widely used by other risk monitoring initiatives. |
Indicator(s) used in CRM:
Data hierarchy: Level 1: All source indicators are assigned Level 1 Rationale: While there are many real-time and forecast-based tracking tools for natural hazards, few compile multi-hazard information to provide a snap-shot of emerging threats. Those that do are often focused on specific regions (e.g., Europe and North America). Under the current iteration of the CRM, information from three mains sources is used. This includes country-level seasonal risk profiles using forecasts derived from Columbia University’s International Research Institute for Climate and Society (IRI). The forecast operates on 2-3 month time horizons, with the CRM’s index primarily focus on above or below average precipitation. Forecasts also provide estimates of expected impacts from ENSO events. In addition to the seasonal forecast, the CRM makes use of a number of other real-time hazard trackers. This includes inputs from the EU’s Global Disaster Alert and Coordination System (GDACS), INFORM’s Natural Hazards Crisis tracker, ACAPS Risk List and FAO’s Desert Locust Monitor—all of which monitor the severity and impact of ongoing hazard events. Alternatives considered: In addition to the three live hazard tracking tools, a number of other options exist including feeds from the USGS, Pacific Disaster Centre, and NOAA. Most have similar coverage and breadth of monitoring systems. To monitor seasonal risks, the CRM currently makes use of a prototype index tracking the proportion of land covered by above or below average expected rainfall. The index has been developed together with Columbia University. Going forward the CRM will make use of a more advanced module that will combine information from the seasonal forecast with forecasts for hurricane basin activity and flood incidence (similarly developed in conjunction with Columbia University). |
| Food Security |
Indicator(s) used in CRM:
Data hierarchy: N/A Rationale: Food insecurity, as with most dimensions of compound risk, is inherently multi-dimensional. While a wide range of indicators are suitable, use of a composite index aggregating information across core dimensions of food insecurity was deemed more appropriate for the CRM. Amongst potential metrics, the World Food Programme (WFP)’s Proteus index was chosen for use in the CRM as a holistic measure of predisposed food insecurity and country-level response capacity. The variable is a multi-dimensional composite that groups indicators according to four dimensions: food availability, access, utilization and stability (see Caccavale and Giuffrida 2020). While the index is comprehensive, it was last updated in 2018 – with little indication as to whether the database will be maintained going forward. Consideration will be given to updating use of the Proteus Index going forward (or selecting suitable alternatives) together with the Agriculture and Food GP. Alternatives considered: A number of alternative metrics were considered, including the Ending Rural Hunger Index, Hidden Hunger Index, Global Food Security Index and WFP Hunger Maps. Another option would be to use current FEWS NET IPC ratings or an average of classifications over a set period (such a one year). In consultation with the Agriculture and Food GP, few were deemed to have the coverage or depth required compared with the Proteus Index. |
Indicator(s) used in the CRM:
Rationale: By far the best-known measure of emerging food insecurity comes from the FEWS NET early warning system. FEWS NET provides periodic and comprehensive multi-agency overviews of current and future food insecurity conditions across 30 monitored countries. In order to ensure alignment with internal WB systems, the choice of indicator threshold is linked to the WB’s Crisis Response Window (CRW) Early Response Financing (ERF) trigger. The Monitor also makes use of data from FAO / WFP’s acute food insecurity early warning initiative (with similar coverage to FEWS NET). In addition to these measurements of the number of people living in food insecurity, the Monitor also measures food price inflation, using WB microdata on monthly food prices. Alternatives considered: Alternative food price volatility metrics were considered in the form of FAO’s GIEWS and FPMA metrics. However, the WB’s internal metrics were deemed to be better aligned with thresholds used by Ag GP. Similarly, use of WFP’s mVAM data may add value going forward. |
| Conflict and Fragility |
Indicator(s) used in CRM:
Rationale: There are a large number of conflict and fragility indexes provided by academia, civil society, and multi-lateral agencies. Given the need for analytical rigour and to ensure internal consistency within the World Bank, the CRM makes use of the Fragile and Conflict-affected Situations’ list as a primary source of data. The metric reflects two main factors: (i) countries affected by violent conflict and (ii) countries with high levels of institutional and social fragility. The choice of indicator and threshold was completed in close consultation with FCV. The Monitor also uses the Fragile States Index, a composite measure widely used by international organisations. Alternatives considered: A number of alternatives were considered, with the four main sources being (i) the Global Peace Index, (ii) INFORM’s Conflict Risk Index, and (iii) the World Bank’s Conflict structural model. Given the need to ensure accuracy of assessment and alignment with official World Bank classifications, none were considered as comprehensive or as widely-used as the FCS list. Going forward, the Monitor will seek to align its metrics with FCV’s Global and Regional Conflict Risk Monitor. |
Indicator(s) used in CRM:
Data hierarchy: Level 1: All source indicators are assigned Level 1 Rationale: Monitoring or predicting of conflict and fragility-related conditions remains a considerable challenge. Given the uncertainties with many forecasting tools, the CRM currently focuses on observed data. First, the Monitor relies on two indicators from the Armed Conflict Location & Event Data Project database (ACLED). ACLED is a widely used and respected resource, monitoring fatalities on a daily basis. The Monitor uses both the number of ‘fatalities related to political disorder and events’, and the number of protests, demonstrations and violent events. For both, the Monitor measures how recent months compare to a country’s historical baseline. The monitor also tracks ‘political disturbance’, measured via the Rulers, Elections, and Irregular Governance dataset (REIGN). (Note that REIGN’s maintenance is currently paused, and the CRM is temporarily reconstructing it with the IFES election calendar and the Global Instances of Coups dataset. These are updated when new elections are declared and coups occur.) In particular, REIGN captures countries where an irregular election or coup has recently taken place. The CRM makes use of the dataset to flag imminent occurrence of elections in fragile or conflict-affected countries. The monitor also makes use of the ACAPS Risk List and the Economist Intelligence Unit’s Security Risk dimension. Use of these indicators to reflect emerging conflict and fragility risk has a number of limitations. In particular, institutional fragility is challenging to reflect accurately. Additional metrics will be considered over time in consultation with FCV. Alternatives considered: The GCRP team considered a number of alternatives. In particular, UCDP’s Battle-Related Deaths database serves as a useful complement to ACLED. However, the database only includes global coverage commencing October 2020, making it difficult to compare against historical baselines. Going forward, a combination of ACLED and UCDP data sources may be adopted. Related to institutional fragility, the main alternative is INFORM’s Severity Index. This metric tracks the severity and status of existing crisis events (with the ability to isolate political and fragility-related events). INFORM is well respected and used by a range of development organizations. Its inclusion within future iterations of the CRM will be actively considered together with the FCV team. In addition, ACAPS and the IRC’s Watchlist provide similar forward-looking fragility outlooks, though neither was deemed to be well matched to the CRM’s current setup. Over time, choice of the CRM’s metrics will align with FCV’s Global and Regional Conflict Risk Monitor (currently under development). |
| Macro-Fiscal Dynamics |
Indicator(s) used in CRM:
Data hierarchy: N/A Rationale: Few holistic measures of exposure and sensitivity to macro-fiscal shocks exist – especially considering the CRM’s need for global coverage. With that in mind, the CRM makes use of the EIU’s Operational Risk Score as an interim measure (to be supplanted by an in-house index currently under development with support from various units across the Bank). As a widely used multi-dimensional index the EIU’s Operational Risk Score (ORS) provides a regularly updated measure of macro-fiscal conditions across a range of different components. It is comprised of 70 grouped indicators across a variety of categories, including: financial risk, foreign trade & payments risk, infrastructure risk, labor market risk, legal & regulatory risk, macroeconomic risk, and tax policy risk. For the purposes of the CRM, ORS categories relating to security, political stability and government effectiveness are removed from the raw measure owing to duplication with other risk dimensions within the CRM. Unlike many alternative risk metrics (such as the WB’s Macro-Financial Review index), the ORS is global in nature, profiling risk scores across 180 countries. In order to reflect levels of underlying vulnerability, the CRM makes use a 12-month ORS average. Use of an average of prior scores provides a (relatively) static assessment of the overall status of macro-fiscal conditions. Inclusion of past values may also help smooth out some of the forward-looking elements of the EIU. This is also consistent with source indicators for underlying vulnerability across other risk dimensions in the CRM – most of which update on an annual basis. Alternatives considered: A number of alternatives for macro-economic vulnerability were considered, including use of a wide range of indicators provided under the World Bank’s Global Economic Prospects (GEP) and IMF’s World Economic Outlook (WEO). In particular, the WB’s Macro-Financial Risk Index (MFRI) has close overlaps with the CRM’s architecture (both on vulnerability and emerging threat elements of risk). Unfortunately, data from the MFRI is only available in 44 countries, meaning that a hierarchy of different indicators would be needed in regions with large data gaps. Alternatives such as the World Bank’s Corporate Vulnerability Index (CVI) and Debt Sustainability Analysis (DSA) are similarly limited – either by concerns over geographic coverage or lack of holistic assessment of macro-fiscal risk conditions. As mentioned in Section 2.2 the CRM is currently trialing an in-house to reflect macro-fiscal elements tailored specifically to the CRM’s overall framework together with inputs from MTI, FCI, CROCR and the Prospects Group (see Annex X). If shown to be robust, the CRM will transition to the in-house metric (either by replacing or complementing the EIU risk score) by mid-2021, once the new metric has been trialed and validated. |
Indicator(s) used in CRM:
Rationale: To gauge whether macro-fiscal risk conditions within a given country are worsening (or likely to worsen in the coming months) the CRM uses a point difference between the latest monthly EIU score and average scores for the previous year (excluding the current period). This provides an overview of countries where the macro-fiscal environment has recently deteriorated relative to expected conditions over the previous year. A similar measure is used by the EIU in referring to upgrades/downgrades in macro-fiscal conditions. Given the ORS updates on a monthly basis, the metric provides a regular update on the status of emerging threats. With global coverage across a range of macro-fiscal elements, use of the ORS does not require use of a hierarchy of data inputs to fill coverage gaps (as with other multi-dimensional macro-fiscal outlooks). As mentioned previously, the Alternatives considered: A number of variants are possible using a similar EIU setup. For example, rather than using a simple point difference, deviations could instead be calculated using a Z-score. However, given that EIU scores are currently only available for the prior 12 months (with many countries exhibiting little variation during this time period), use of a difference in values is currently preferred. Efforts are currently underway to secure access a longer timeseries of OSR data which may facilitate an update of methods. In addition, the current approach compares values for the current month relate to the 12-month mean. While this provides a decent gauge of recent upgrading/downgrading of macro-fiscal conditions, it may be of use to extent the observational period to 3 (or even 6) months. This would allow for broader terms to emerge (especially for risk conditions that materialize slowly over time or have lagged effects). However, this extended approach would only be suitable with access to longer-term OSR timeseries data (past 12 months) – something the CRM team are actively pursuing. In addition, and as mentioned previously, the CRM team will continue to trial an in-house measure for tracking emerging macro-fiscal threats. The measure will seek to extent existing WB metrics (such as the MFRI, CVI, DSA, etc.) to allow for greater geographic coverage and better fit within the scope of the CRM’s analytical framework. |
| Socioeconomic Vulnerability |
Indicator(s) used in CRM: Data hierarchy: N/A Rationale: As with many of the compound risk dimensions, socio-economic vulnerability is a multi-dimensional concept. It’s inclusion in the CRM recognises that compounding events are a product not only of exposure to consecutive (or overlapping) hazards, but the ability of people and communities to cope with and respond to emerging threats. Severe heightening of socio-economic vulnerabilities can often lead to compounding events, even in cases where exposure to mild overlapping threats would otherwise not lead to a disaster. With that in mind, the CRM currently makes use of the INFORM’s Socio-Economic Vulnerability Index as a composite measure comprised of traits related to deprivation, inequality, dependency, uprootedness and composition of vulnerable groups. Alternatives considered: There are a large number of socio-economic vulnerability indexes. This includes OPHI’s Multi-dimensional Poverty Index (Oxford), UN Human Development Index, the ND-GAIN Vulnerability Index (Notre Dame) alongside others. Many country-level outcomes across these indexes are correlated and use of INFORM is consistent with its inclusion in a number of other dimensions. |
Indicator(s) used in CRM:
Data hierarchy: Level 1: All source indicators are assigned Level 1 Rationale: Finding real-time global measures of socio-economic vulnerability is a considerable challenge, particularly regarding those that reflect household-level conditions and coping capacities. Having consulted widely with the WB’s Prospects team, Poverty and Equity GP, and Development Data Group, the CRM team assembled a basket of indicators. The first metric concerns country-level poverty projections. Figures are taken from the World Bank’s Macro Poverty Outlook (MPO), with forecasted percentage point differences in the proportion of people living below $1.90 chosen as a proxy for deteriorating household-level coping capacities. Percentage point differences for both 2021-2020 and 2020-2019 are used in the current iteration, recognising that the knock-on implications of increased poverty on household-level vulnerability can persist for long periods of time. In addition to poverty, inclusion of unemployment forecasts is included to factor future changes in labour conditions and livelihood opportunities using the IMF’s World Economic Outlook. As with GDP inputs, percentage point differences for both 2021-2020 and 2020-2019 are used (for the same reasons). Alongside this, the CRM uses MFRI’s composite measure of household-level risk (made up of changes to household debt-to-GDP ratios and unemployment rates during the previous quarter). Alternatives considered: Suitable alternatives for social-economic vulnerability are actively being considered together with DEC and Poverty and Equity GP. One option may be the inclusion of estimates of inequality as a proxy for increased vulnerability in lower income quantiles. However, forward looking estimates for inequality are not currently available. Instead, estimates of forecasted unemployment are included as an indicator with close overlaps and characteristics of being a driver of inequality. |
| Health Security and Pandemic Response |
Indicator(s) used in CRM:
Rationale: Choice of indicators for measuring pre-existing health security capacity remains contentious. Prior to the COVID-19 pandemic, the most comprehensive and commonly referred to metric for pandemic preparedness was the Global Health Security Index (GHS). The measure is a composite index combining 85 sub-indicators (across 6 health categories) with solicitation of a panel of 21 leading health experts. While the measure is undoubtedly comprehensive, it has proven a relatively poor correlate of present day COVID-19 exposure and response, especially considering high rates of incidence and impact in Europe and North America, coupled with lower-than-expected impacts in parts of Africa and Southeast Asia. With that in mind, and in consultation with the Health GP, the CRM includes the GHS Index alongside a COVID-specific metric developed by the European Union’s Joint Research Centre INFORM initiative. The INFORM COVID Risk Index is an adaptation of the INFORM initiative’s Epidemic Risk Index, used to support prioritization of preparedness and early response actions for the primary impacts of the pandemic. The two inputs are aggregated, with high-risk thresholds assigned by the GCRP team in consultation with Health GP. Alternatives considered: Alternatives were considered in the form of the Epidemic Preparedness Index (Oppenheim et al. 2018). However, many similar indexes are less comprehensive than the GHS and suffer from the same lack of correlation in predicting the country-level impacts of COVID-19. |
Indicator(s) used in CRM:
Data hierarchy: Level 1: All source indicators are assigned Level 1 Rationale: The two measures of emerging risk are provided by the WHO’s Disease Outbreak News (DONs) alerts, a real-time system providing information on all disease outbreaks notified to the WHO, and the IFRC’s list of on-going epidemics. Alternatives considered: A large number of metrics exist in tracking the impacts of COVID-19. Alternatives that may add value to future iterations of the CRM include excess mortality and test positivity rates. However, gaps in data coverage and quality limit their inclusion at the present. Given the changing nature of COVID’s impacts on Global health systems, the CRM will periodically review choice and prominence of COVID-19 metrics in consultation with the WB’s Health GP. Inclusion of other suitable metrics such as vaccination coverage are currently being explored. Data hierarchy: Level 1: All source indicators are assigned Level 1 Rationale: The primary measure of emerging health risk is provided by the WHO’s Disease Outbreak News (DONs) alerts – a real-time system providing information on all disease outbreaks notified to the WHO. Given the prominence of COVID in affecting global health system, the CRM makes use of several COVID-monitoring tools. To begin with, indicators of COVID incidence are chosen in the form of bi-weekly changes in both case counts and deaths (including numbers per 1M and growth rates). In addition to exposure, response capacities are factored in through three policy trackers provided by Oxford University’s Blavatnik School of Governance: the Government Response Index and Lockdown Rollback Index. Alternatives considered: A large number of metrics exist in tracking the impacts of COVID. Alternatives that may add value to future iterations of the CRM include: excess mortality and test positivity rates. Gaps in data coverage and quality limit their inclusion at the present. Given the changing nature of COVID’s impacts on Global health systems, the CRM will periodically review choice and prominence of COVID metrics in consultation with the WB’s Health GP. Inclusion of other suitable metrics such as vaccination coverage are currently being explored. Additionally, this risk dimension will continue to be explored, especially as the impacts of COVID are expected to diminish over time – through 2021 and beyond. |
Step 2: Bounded normalization
The next step in the process is normalizing each indicator on a scale from 0–10. In doing so, the CRM assigns each indicator an upper and lower bound based on high and low risk thresholds. In most cases, expert elicitation is used to define bounds for the min-max normalization process. All indicator values above the upper threshold are then assigned a value of 10 (and considered high risk); values below the lower threshold are assigned 0 (considered little-to-no risk); and all other values receive a normalized score that falls somewhere in-between (using the formula below). The normalized procedure is described below, where \(IndicatorRaw_i\) represents a country’s score for a given indicator i (for all values in-between the threshold bounds). \(ThresholdLower_i\) and \(ThresholdUpper_i\) are the designated lower and upper thresholds for respective indicators and \(IndicatorNorm_i\) is the normalized indicator score ranging from 0–10.
\[IndicatorNorm_i = \frac{IndicatorRaw_i - ThresholdLower_i}{ThresholdUpper_i - ThresholdLower_i}\cdot 10\]
Where possible, the CRM seeks to align upper and lower bounds with risk thresholds used by other WB teams or based on widespread expert consensus. There are three exceptions to this procedure, requiring some degree of subjective interpretation. Firstly, where no expert consensus on risk thresholds exist, normalized bounds are assigned via percentiles (typically 95th/5th). Secondly, in cases where pre-existing vulnerability categories are specified, or where differences between risk categories are non-linear, the CRM defaults to using expert-defined categories as the basis of indicator scores. For example, the World Bank’s Debt Sustainability Analysis (DSA) rates countries’ likelihood of external debt distress in three categories: Low; Moderate; and High. In this case, the CRM manually aligns scores with the DSA categories (using values of 3, 7 and 10 respectively). Lastly, in instances where binary indicator outcomes exist – e.g. whether a drought is ongoing or not – the CRM simply assigns a 10 or 0, with no normalized values in-between.
There are three reasons for transforming raw indicator scores using bounded normalization:
It allows for ease of comparability across indicators – with all scores falling between 0–10;
It reduces the influence of outliers. Many sources of risk information are heavily skewed, and provision of upper and lower bounds helps to diminish their influence on all intermediary scores (note that that this can also be addressed using Z-scores); and
It allows for simple and transparent identification of high/low risk countries. A score of 10 means that a country has exceeded the designated threshold for the respective indicator, a 0 reflects a country that is considered very low risk. This simplicity of interpretation is of particular use when it comes to aggregating indicators together to form a single score for each dimension of compound risk.
Step 3: Indicator aggregation
After the normalization procedure, indicators are grouped and aggregated by risk dimension to generate an individual risk score for all six dimensions of compound risk. Separate scores are assigned for Underlying Vulnerability and Emerging Risk. The simplest and most transparent way of aggregating scores is to take the maximum value across grouped risk indicators for each given dimension.
\[RiskDimension = \ \max_{i = 1\ldots n}\left\{ IndicatorNorm_i \right\}\]
Here \(RiskDimension\) is the score for a given dimension of compound risk r, with the maximum score for all normalized indicators (\(IndicatorNorm_i\)) selected across the suite (\(i= 1\ldots n\)). For example, if a given country’s food security is made up of three source indicators (with scores of 5, 7, and 8 respectively), then food security risk will simply be listed as the highest value in the suite (8 in this case). In each of these cases, normalized values are aligned with the upper (and lower) bounds defined by expert elicitation and represent high (and low) risk. The process mimics the methodology of a number of similar risk monitoring systems, including the WB’s Macro-Financial Risk Index. This step results in a score for each dimension of compound risk ranging from 0–10. A risk dimension with a score of 10 implies that at least one of the grouped indicators in the dimension is above the risk threshold.
In some instances, dimensions consist of indicators with variable quality. For example, a selection of inputs may be high-quality with limited geographic coverage. Others may reflect weaker proxies but provide data for all countries. In such instances, a hierarchy of data inputs is specified (see Tables 1 and Annex Tables 1–2). Firstly, the nature of the data hierarchy is established, typically by grouping indicators into two levels: Level 1 (consisting of high-quality low coverage indicators) and Level 2 (lower quality higher coverage). For dimensions that use a data hierarchy, scores are assigned solely on the basis of Level 1 indicators wherever country data exists (i.e. the maximum value of all Level 1 indicators). In countries where no Level 1 data is available, the CRM reverts to aggregating Level 2 data instead. For example, in the case of the Food Security component, FEWS NET is used as a Level 1 data source meaning that in countries where available information exists FEWS NET ratings take precedence. In cases where data is unavailable, the CRM falls back on food price volatility data (gathered by the WB’s Food Price Monitor) as a proxy for food insecurity.
While this aggregation method is very easy to implement and interpret, methodological simplicity inherently comes with tradeoffs (for alternative methods considered see Supplementary Material Text 1 in the Annex). In this case, sole use of max values means that false positives are more likely than with other methods. For example, if a chosen country’s three food security indicators are observed as 10, 2 and 3 respectively, then the max score of 10 would fail to represent this diversity. This is especially problematic in examples where there may be a large number of source indicators in a given dimension of compound risk (and therefore higher likelihood that at least one score is a 10), or where poor proxies are used (that may not be in line with the suite of other indicators). Similarly, a max system does little to differentiate between the severity of high-risk countries. Returning to the same food security example, a country with scores of 10, 10 and 10 would be rated the same as the previous example of 10, 2 and 3. Finally, use of a data hierarchy means that cross-country comparisons can be problematic as different countries may use different data inputs. Given the alternative of limiting information to only countries with the highest-quality data, and perhaps misrepresenting the geographic spread of risk further, the CRM adopts the hierarchy approach while seeking to clearly communicate all sources of inputs.
Step 4: Approximating Overall Compound Risk
While information from Underlying Vulnerability and Emerging Threat scores are useful in and of themselves, many users of the CRM will want to weigh recent or upcoming threats against a country’s underlying levels of vulnerability. As such, the CRM produces a third score (termed “Overall Alert Flags”) for each risk dimension by combining Underlying Vulnerability and Emerging Threats scores. The default approach to aggregate the two scores using a geometric mean (see Annex X for alternatives that use a filtering approach). The approach provides a broad overview of the level of alertness needed in weighing the importance of changing risk conditions relative to a country’s coping capacity: i.e. a gauge of vigilance required in monitoring ongoing (or upcoming) in the months ahead relative to normal conditions. With that in mind, combining vulnerability and emerging threat elements ensures that countries that have seen a modest increase in emerging threats, but low levels of underlying vulnerability are weighted downwards, while those that have seen slight increases in emerging threats, but high overall levels of underlying vulnerability are weighted upwards.
The CRM’s proposed method is very similar to approaches taken by INFORM and other multi-dimensional risk indexes. Here \(RiskDriverMax_r\) is the emerging threats score for dimension \(r\), and underlying vulnerability is represented by \(ExistingRisk_r\).
\[AlertLevel_r = \sqrt[2]{RiskDimensionMax_r \cdot ExistingRisk_r}\]
This results in a score ranging from 0–10, which can similarly be further grouped into three broad categories. Scores ranging from 7–10 are deemed to represent a high-alert status, scores between 5–7 are seen as medium alert status and scores between 0–5 considered low-alert status.
The combined score should be considered a more accurate reflection of the level of alertness needed in monitoring and responding to given risks – one that permits comparisons across countries in a more direct manner than for simple use of the Emerging Threats score (which charts changing risk conditions relative to the norm). The benefits of combining scores from Underlying Vulnerability and Emerging Threats into a single high-level measure can be seen in how the approach weighs the two scores together. Despite the need for vigilance in any context facing intensification of emerging threats, alert levels are likely to be far reduced in countries with low levels of vulnerability (owing to the fact that severe crises are less likely). Similarly, concern should be far higher whenever a vulnerable country experiences a worsening of risk conditions (even if a slight or moderate). Indeed, in the context of a supporting early action for crisis risk prevention these are typically the countries and contexts of primary interest. It is, however, worth remembering that the CRM is designed as a flagging system, not a predictive tool. A high Overall Alert Flag score does not mean that a compound crisis is expected to materialize. Instead, it signals the preconditions and catalytic environment for one.
Use of a geometric average seeks to better account for the close relationship between underlying vulnerability and emerging threats, as well as the fact that outcomes and likely to be multiplicative. The same approach is used in a number of other risk metrics (including INFORM), and well supported in the wider risk literature – see Guillaumont (2009). However, it is important to note that Overall Alert Flags can similarly be calculated using a number of the alternative methods – such as an arithmetic mean or max value). Each has their own strengths and weaknesses (a detailed discussion and comparison of different options is presented in Section 3.2).
Step 5: Determining country alert levels for underlying vulnerability, emerging threats and overall compound risk
Alongside separate scores for all six risk dimensions, the CRM also assigns country-level scores summarizing risk profiles for Underlying vulnerability, Emerging Threats and Overall Alert Flags. These are done by summing (or “flagging”) the total number of risk dimensions classified as high (or high + medium) within a given country. While use of a combined metric helps to put a country’s current (and future) risk conditions into perspective, care should be taken in interpreting Overall Alert Flags given the fact that indicators (and thresholds) Underlying vulnerability and Emerging Threats are not wholly compatible across all risk dimensions. For this reason, the CRM present all three country-level scores separately, allowing the user to determine which measure is of most relevance given the intended use.
The most straightforward method is to assign a “1” for each risk dimension classified as high risk. For example, if a country has Emerging Threat flags for food security and socio-economic vulnerability (i.e. scores of 10 across both risk dimensions), then the country’s Emerging Threat score will be 2.
\[RiskDimensionHigh_r = \ \left\{ \begin{matrix} 1\ \ \ \ \ \ \ RiskDimensionCategory_r = HighRisk \\ 0\ \ \ \ \ \ \ RiskDimensionCategory_{r} \neq HighRisk \\ \end{matrix} \right.\ \]
\[TotalCompoundRisk_{c} = \sum_{r = 1}^{6}{RiskDimensionHigh_{r}}\]
This results in a single country-level score ranging from 0–6. A score of 6 (or 6 risk flags as referred to in the CRM) simply implies that all six dimensions are considered high risk. The method tells us how many dimensions are considered high-risk and can be used to gauge whether multiple preconditions exist for emerging compound crises. It is easy to compute, and above all, simple to interpret: a country’s score (whether for Underlying vulnerability, Emerging Threats or Overall Alert Flags) is equivalent to the number of high-risk dimensions for a given country. It also allows for the status of emerging compound risk to be readily compared, both within and across countries – noting the various methodological caveats outlined above.
Classification of risk dimensions into categories differ slightly between Underlying vulnerability, Emerging Threats and Overall Alert Flags owing to the different aggregation methods used. Risk dimension scores of 10 are classified as high risk For Underlying vulnerability and Emerging Threats, implying that at least one of the grouped indicators is about the high-risk threshold (based on the Max Value approach). Dimensions scores ranging from 7–10 are deemed medium risk. For Overall Alert Flags, risk dimensions with scores ranging between 7–10 are labelled high risk owing to the fact that scores are derived from a combination of Vulnerability and Emerging Threat elements. Dimensions with scores from 5–7 are therefore classified as medium risk.
Given that risk is seldom (if ever) binary, a second approach is to assign an intermediary score for all medium-risk countries. This recognizes the limitations of assigning a 0 to all dimensions below the high-risk threshold. Indeed, countries with dimension scores just under the high-risk threshold are likely to be of much higher risk than those far below the lower threshold. Accordingly, the CRM calculates an alternative measure of overall underlying vulnerability and emerging threats by assigning a half-value to medium-level risks.
\[RiskDimensionHighMed_{r} = \ \left\{ \begin{matrix} 1\ \ \ \ \ \ \ \ \ \ \ \ \ RiskDimensionCategory_{r} = HighRisk \\ 0.5\ \ \ \ \ \ \ \ \ \ RiskDimensionCategory_{r} = MedRisk \\ 0\ \ \ \ \ \ \ \ \ \ \ \ \ \ RiskDimensionCategory_{r} = LowRisk \\ \end{matrix} \right.\ \ \]
\[TotalCompoundRisk_{c} = \sum_{r = 1}^{6}{\RiskDimensionsHighMed_{r}}\]
In this instance, compound risk\(\ (TotalCompoundRisk\)) in country c, is calculated as the sum of all medium-risk dimensions (assigned a 0.5) and high-risk dimensions (assigned a 1). For example, a country with a high-risk flag for Health and a medium-risk flag for Food security would be listed as having a total of 1.5 compound risk flags. This isn’t as intuitive as the previous setup. However, it is still relatively easy to interpret and communicate. More importantly, a combination of high and medium risk flags provides a more holistic representation of underling risk conditions. Users will able to differentiate between the two methods (i.e. high-risk only and medium + high-risk) using the CRM database and interactive Dashboard. For this reason, the combined medium and high-risk flagging system is used as the default for the remainder of this Note15.
While the CRM is based on a simple sum of risk flags as a means of promoting ease of interpretability and transparency, a number of aggregation options exist. For example, the CRM team also considered use of an averaging method. Country-level score could be calculated as the average of the six dimension-level scores. However, this approach suffers from many of the same weaknesses as use of averaging methods in deciding individual dimension-level scores. In particular, compound crises tend to occur when underlying dimensions of risk are above a country’s coping capacity (i.e. above high-risk thresholds). They can also occur when just two or three dimensions of compound risk interact – even if conditions in other dimensions are relatively stable. For example, a country with three emerging dimensions above the high-risk threshold (i.e. scores of 10) and three dimensions below the high-risk threshold (i.e. scores of 0) would only have an average overall emerging threats score of 5 despite displaying heightened preconditions for compound risk (recognizing that average emerging threats scores would range from 0–10 rather than 0–6). Instead, use of the flagging system clearly highlights instances where coping capacities are likely to be exceeded across any of the six dimensions and does not dilute overall results when other dimensions might be experiencing normal (or below-normal) risk conditions. For this reason, the CRM is built around a max-value flagging system. However, users are free to download the data manually and adjust the methodology accordingly.
Step 6: Cross-validation, expert elicitation and continual updating
Finally, expert elicitation is used to complement the CRM’s outputs before they are shared with end users in the Bank. The expertise and judgement of WB sectoral experts is an essential element of the overall CRM methodology, guiding indicator selection, aggregation as well as identification of appropriate thresholds. Furthermore, before they are shared with end users, quantitative results from the CRM will be cross-checked by WB sector and regional experts to detect anomalies in the flag-based system, as well as to complement the CRM’s findings with rich qualitative insights from a range of WB experts.
To support this expert elicitation process, a Technical Steering Group will be set up building on the informal working level consultations conducted during the methodological design phase. The Steering Group will allow for continuous expert inputs into the CRM methodology as well as review of CRM outputs. The Steering Group will include at least one focal point for each of the six dimensions of compound risk and it is expected that it will be convened quarterly as part of the GCRP’s horizon scanning exercises. The quarterly horizon scan will include the output of the CRM , as well as additional interpretation provided by the Technical Steering Group that would modulate the understanding of the quantitative CRM outputs.
Zscheischler, J., Martius, O., Westra, S., Bevacqua, E., Raymond, C., Horton, R. M., ... & Maraun, D. (2020). A typology of compound weather and climate events. Nature reviews earth & environment, 1(7), 333–347.↩︎
The INFORM Risk Index identifies six ‘categories’ of risk, outlined as: natural hazards; human hazards; socio-economic vulnerability; vulnerable groups; institutional coping capacity; and infrastructural coping capacity. ND-GAIN similarly has six ‘sectors’ of vulnerability, including: food, water, health, ecosystem services, human habitat and infrastructure; and three ‘components’ of readiness, comprising: economic readiness; governance readiness; and social readiness. WFP’s early-warning of acute food insecurity is another relevant compound risk monitor, tracking changing risk conditions across eight ‘risk types’: tropical cyclones, locusts, dry conditions, floods, conflict/insecurity, political instability/unrest, displacement and economic crises.↩︎
Note that given current the current global risk landscape, an emphasis is placed on COVID-related impacts, particularly for the Health dimension. Over time, this will reorient towards a broader focus on ‘Pandemic response capacity’ as the impacts of COVID subside globally.↩︎
https://www.worldbank.org/en/topic/fragilityconflictviolence/brief/harmonized-list-of-fragile-situations↩︎
Note that household-level category is removed from the MFR heatmap, as it serves as an input to the socio-economic vulnerability dimension↩︎
Phone survey data is collected through the COVID-19 High-Frequency Monitoring Dashboard. Link to the publicly available database: https://www.worldbank.org/en/data/interactive/2020/11/11/covid-19-high-frequency-monitoring-dashboard↩︎
In the current context, these sources can be thought of as reflecting conditions prior to the COVID pandemic.↩︎
In the current context, the information presented here can be thought of as reflecting ongoing risk conditions during the COVID pandemic.↩︎
Given that overall risk scores are calculated using inputs from both underlying vulnerability and emerging threats, the procedure is somewhat different (see Annex Supplementary Text 1).↩︎
A number of the early warning metrics are binary in nature (i.e. whether a natural hazard has occurred or not). In such cases, indicators are simply assigned a 10 or 0 with no normalised values in between. See Annex Table 1–2 for further details↩︎
Aggregation differs for each dimension of compound risk based on the quality and coverage of underlying indicators. See the Annex for further details.↩︎
Note that high risk scores for underlying vulnerability and emerging threats are represented by a score of 10, while those for overall alert flags are represented by scores greater than 7 (owing to different aggregation methods). In cases where country-level scores are generated using the sum of both medium and high-risk dimensions, medium risks are assigned a half value (0.5) compared with a full value (1) for high-risks.↩︎
Aggregation of the conflict and fragility dimension is an exception. This is calculated using an arithmetic mean owing to the fact that Underlying Vulnerability scores are derived from a simple binary indicator (whether or not the country is included on the FCS list). Reasons for this are further elaborated in Section 3.2.↩︎