3 Dimensions
From a conceptual point of view, the CRM breaks compound risk down into six dimensions:
![]() Food Security
Food Security
![]() Conflict and Fragility
Conflict and Fragility
![]() Health
Health
![]() Macro-Fiscal
Macro-Fiscal
![]() Natural Hazards
Natural Hazards
![]() Socio-economic
Socio-economic
These six dimensions can be seen as preconditions (or catalysts) likely to contribute to compounding effects. Each dimension integrates aspects related to exposure, vulnerability and response capacity.
For each dimension of compound risk, the CRM provides three country-level outlooks:
- Underlying Vulnerability: an overview of a country’s predisposition to specific threats, typically based on an evaluation of structural conditions and underlying capacities related to each risk dimension;
- Emerging Threats: a dynamic view of changing risk conditions – signaling countries that are experiencing (or are expected to experience) worsening/intensification of risk conditions; and
- Overall Compound Risk: a combined score that weighs emerging threats against a country’s underlying vulnerability.
The latter outlook can be seen as a high-level approximation of the level of vigilance needed in considering whether emerging threats are likely to materialise into compound crises.
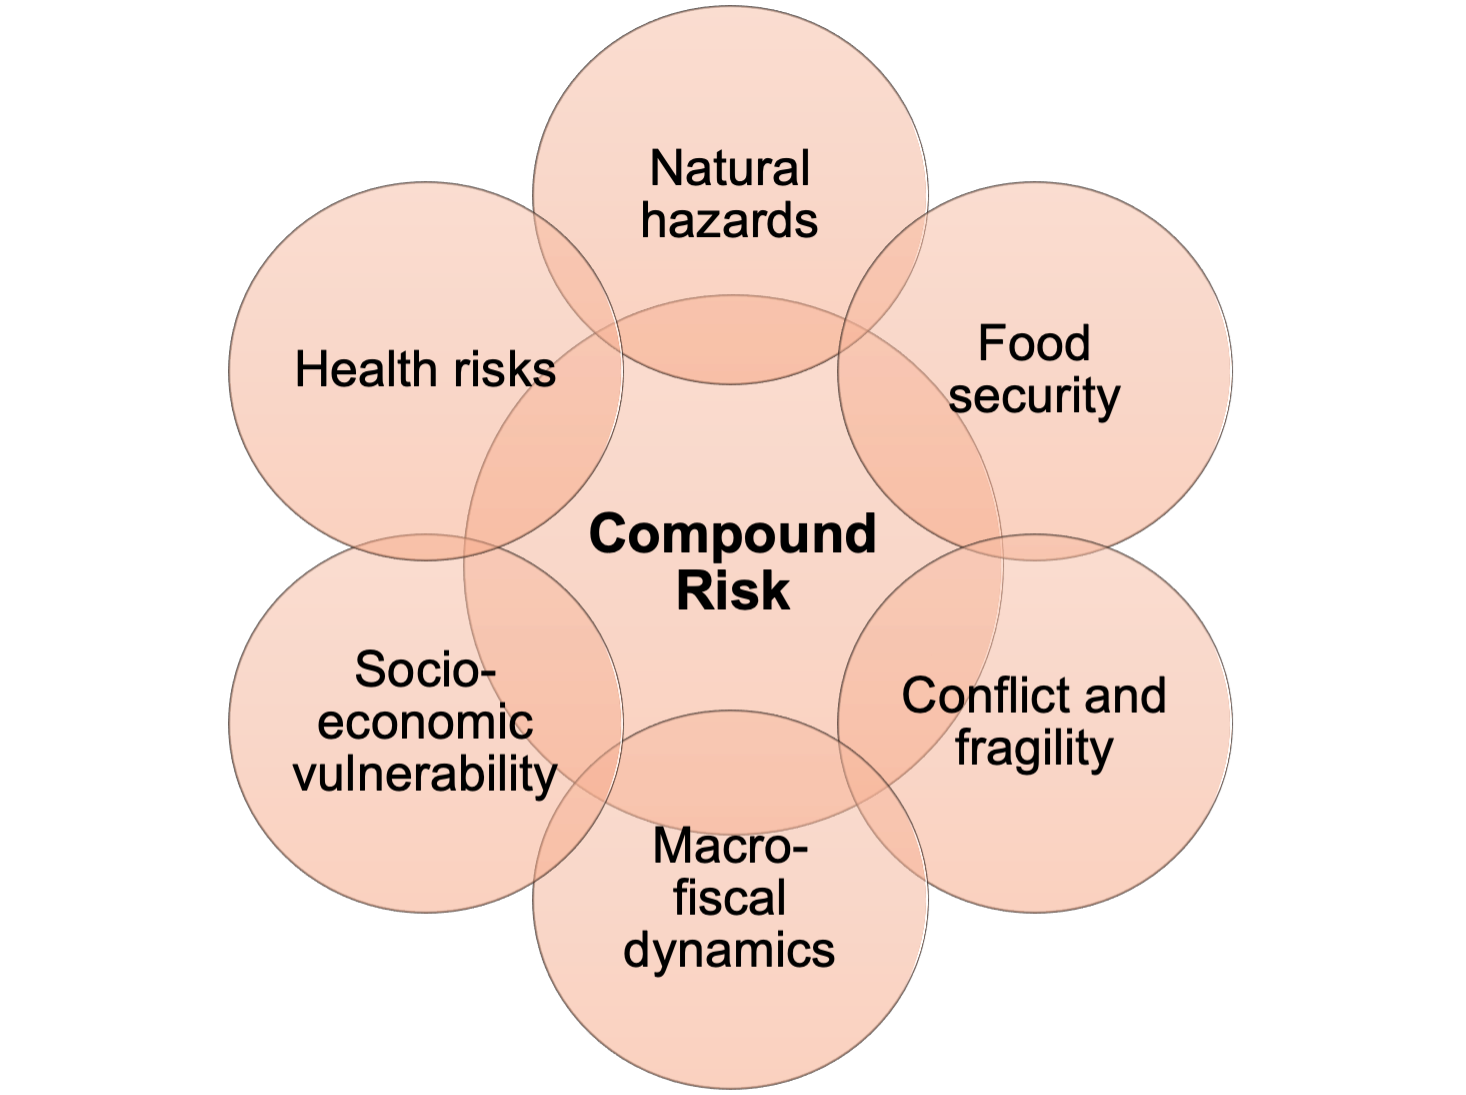 Note: The graphic above highlights the conceptual overlap between the six dimensions of compound risk selected and overall compound risk. In reality, there are more overlaps across individual dimensions.
3.1 Food Security
Food Security Summary Card
Food insecurity within the CRM is defined as contexts where people do not have adequate physical, social or economic access to food. This holistic definition recognizes that there is no single metric of food insecurity, and rather demands multi-dimensional measures covering all aspects related to access to sufficient amounts of safe and nutritious food.
Key contacts
- Madhur Gautam, Lead Economist, Agriculture Global Practice
- Zacharey Carmichael, Team Leader for the Famine Action Mechanism
Underlying indicators
| Underlying Vulnerability |
| Economist Intelligence Unit’s Global Food Security Index |
| Proteus Composite Index |
| Emerging Threat |
| FAO WFP Warning |
| FEWSNET Score |
| World Bank monthly food price estimates |
Description
As highlighted above, the CRM defines compound risk in relation to the interaction of both hazards and underlying vulnerabilities. In this sense, while food insecurity can often result as consequence of specific threats (such as natural hazards or conflict), high levels of food insecurity can significantly increase a community’s sensitivity and vulnerability to other compounding threats. Food insecurity within the CRM is defined as contexts where people do not have adequate physical, social or economic access to food. This holistic definition recognizes that there is no single metric of food insecurity, and rather demands multi-dimensional measures covering all aspects related to access to sufficient amounts of safe and nutritious food. Food security also features as a core dimension of both the ND-GAIN, FAO/WFP EWA.
3.1.1 Underlying Vulnerability
| Indicator | Description | Normalization |
|---|---|---|
| Economist Intelligence Unit’s Global Food Security Index | Normalised using a min/max procedure with a lower bound of 90th pct and upper bound of 10th pct | |
| Proteus Composite Index | Index of multidimensional aspects of food security made up of grouped indicators for: Availability; Access; Utilization; and Stability | Normalised using a min/max procedure with an upper bound of 90th pct and lower bound of 10th pct |
Aggregation
Use GFSI when indicator is available for a country; use Proteus Composite Index as a backup when data is unavailable.
Rationale
Food insecurity, as with most dimensions of compound risk, is inherently multi-dimensional. While a wide range of indicators are suitable, use of a composite index aggregating information across core dimensions of food insecurity was deemed more appropriate for the CRM. Amongst potential metrics, the World Food Programme (WFP)’s Proteus index was chosen for use in the CRM as a holistic measure of predisposed food insecurity and country-level response capacity. The variable is a multi-dimensional composite that groups indicators according to four dimensions: food availability, access, utilization and stability (see Caccavale and Giuffrida 2020). While the index is comprehensive, it was last updated in 2018 – with little indication as to whether the database will be maintained going forward. Consideration will be given to updating use of the Proteus Index going forward (or selecting suitable alternatives) together with the Agriculture and Food GP.
3.1.2 Emerging Threat
| Indicator | Description | Normalization |
|---|---|---|
| FAO WFP Warning | Food security early warning released jointly by FAO and WFP. | 10 = on FAO/WFP list of early warning countries |
| FEWSNET Score | FEWSNET IPC classification (near term) adjusted. | Assigned values based on CRW threshold: 10 = CRW threshold 9 = Below CRW & IPC5 8 = Below CRW & IPC4 7 = Below CRW & IPC3 5 = Below CRW & IPC2 3 = Below CRW & IPC1 0 = Below CRW & no IPC |
| World Bank monthly food price estimates | Food Price Inflation (gathered by WB’s Food Price Monitor). | Assigned values based on IPA threshold: 10 = FPV above 30% 7 = FPV between 5-30% 5 = FPV between 2-5% 1 = FPV below 2% |
Aggregation
Max value of FAO WFP Warning and FEWSNET Score; if neither are available, uses Food Price Volatility
Rationale
By far the best-known measure of emerging food insecurity comes from the FEWS NET early warning system. FEWS NET provides periodic and comprehensive multi-agency overviews of current and future food insecurity conditions across 30 monitored countries. In order to ensure alignment with internal WB systems, choice of indicator threshold is linked to the WB’s Crisis Response Window (CRW) Early Response Financing (ERF) trigger. The Monitor also makes use of data from FAO / WFP’s acute food insecurity early warning initiative (with similar coverage to FEWS NET). Outside of IPC-classified countries, there are few multi-dimensional indexes that provide similar levels of detail. One alternative is to use food price information, for which geographic coverage of information is far larger. Food price inflation and volatility are considered acceptable proxies for emerging food insecurity conditions and is used in the CRM in countries where there are no data alternatives. Data and thresholds for food prices are gathered from the WB’s Food Price Monitor.
3.2 Conflict and Fragility
Fragile and conflict-affected states are among the contexts with the highest potential for compound risk. In particular, coping capacity is often limited, with weakened country systems unable to respond to shocks, exacerbating impacts on lives and livelihoods. The CRM considers both violent conflict – reflecting widespread and intense violence across many parts of the country, as well as institutional fragility – reflecting countries facing deep institutional crises, that have very poor transparency and government accountability, or that have weak institutional capacity. The CRM’s definition of conflict and fragility mirrors the World Bank’s classification of fragile and conflict-affected situations.
3.2.1 Underlying Vulnerability
| Indicator | Description | Normalization |
|---|---|---|
| FCS List | World Bank’s Fragile and Conflict-affected Situations list. Multidimensional index including information on the following: Country Policy and Institutional Assessment (CPIA) scores, whether a UN peacekeeping operation is present, the severity of border flight, and conflict-related deaths. | Assigned values in consultation with FCV. 10 = If on FCS list 0 = If not on FCS list (based on FCS thresholds) |
| Fragile States Index | A composite measure from Fund for Peace | Normalised using a min/max procedure with an upper bound of 98th pct and lower bound of 40th pct |
Rationale
There are a large number of conflict and fragility indexes provided by academia, civil society and multi-lateral agencies. Given the need for analytical rigour and to ensure internal consistency within the World Bank, the CRM makes use of the Fragile and Conflict-affected Situations’ list as a primary source of data. The metric reflects two main factors: countries affected by violent conflict; and countries with high levels of institutional and social fragility. Choice of the indicator and threshold was done in close consultation with FCV.
3.2.2 Emerging Threat
| Indicator | Description | Normalization |
|---|---|---|
| ACLED Political Fatalities | Fatalities related to violent events, demonstrations or non-violent actions (ACLED).Indicator is calculated as 3-month running Z-scores using 3-month means and standard deviations for the past three years. | Normalised using a min/max procedure with an upper bound of 1 and lower bound of -1 |
| Protests, demonstrations, and violent events (ACLED) | Percentage increase in the number of conflict events in the past month, relative to the past year’s monthly average | Normalized using a min/max procedure with an upper bound of 25% increase and a lower bound of no change |
| REIGN Political Disturbance | Political disturbance (REIGN) Indicator is formed by summing results from 4 REIGN binary variables, including: successful coup; attempted coup; delayed election; and irregular election. Inputs from election variables are only considered in FCS countries. REIGN is currently inactive; it is currently replicated using election data from the International Foundation for Electoral Systems , and coup data from the Global Instances of Coups dataset |
10 = at least one event across the REIGN indicators 0 = no events across the REIGN indicators |
| ACAPS Risk List | Events related to conflict and fragility recorded by ACAPS | 10 = High risk 7 = Medium risk 3 = Low risk |
| EIU Security Risk | Point change in Economist Intelligence Unit’s Country-level Operational Risk scores for Security Risk, excluding hostility to foreign. The EIU Operational Risk is a multi-dimension index tracking macro-fiscal conditions updated on a monthly basis. | Normalised using a min/max procedure with an upper bound of 95 th pct and lower bound |
Rationale
Monitoring or predicting of conflict and fragility-related conditions remains a considerable challenge. Given the uncertainties with many forecasting tools, the CRM currently focuses on observed data across three primary indicators – each tied closely to the WB’s FCS list. The first is fatalities related to political disorder and events using the Armed Conflict Location & Event Data Project database (ACLED). ACLED is a widely used and respected resource, monitoring fatalities on a daily basis. The second is political disturbance measured via the Rulers, Elections, and Irregular Governance dataset (REIGN). In particular, REIGN captures countries where an irregular election or coup have recently taken place. The CRM makes use of the dataset to flag imminent occurrence of elections in fragile or conflict-affected countries. Lastly, a metric for large deviations in forcibly displaced people is included as measured by UNHCR. Given difficulties with tracking displacement in real-time, the CRM measures changes in 2019 movement compared with a five-year baseline. Use of the three indicators to reflect emerging conflict and fragility risk has a number of limitations. In particular, institutional fragility is challenging to reflect accurately, and additional metrics will be considered over time in consultation with FCV.
3.3 Health
The ongoing COVID pandemic is a prime example of the potentially devastating impacts of disease outbreaks on economies and societies. With this in mind, the CRM features a measure of: i) the effectiveness of a country’s healthcare system; ii) exposure to ongoing (or potential) health-related threats, namely epidemics and pandemics; and iii) the immediate implications of response options (or lack thereof) on a country’s ability to contain an ongoing threat.
3.3.1 Underlying Vulnerability
| Indicator | Description | Normalization |
|---|---|---|
| GHSI Score | Global Health Score Index, a composite index made up of a variety of health-related indicators. GHS is made up of six categories (comprised of 34 indicators, 85 sub-indicators). The categories include: prevention; detection and reporting; rapid response; health system; compliance with international norms; and risk environment. For more details see link. | Normalised using a min/max procedure with an upper bound of 20 and lower bound of 70 |
Rationale
Choice of indicators for measuring pre-existing health security capacity remains contentious. Prior to the pandemic, the most comprehensive and commonly referred to metric for pandemic preparedness was the Global Health Security Index (GHS). The measure is a composite index combining 85 sub-indicators (across 6 health categories) with expert solicitation of a panel of 21 leading health experts. While the measure is undoubtedly comprehensive, it has proven a relatively poor correlate of present day COVID exposure and response. Much of this is witnessed by heavy rates of incidence and impact in Europe and North America, coupled with lower-than-expected impacts in parts of Africa and South East Asia. With that in mind, and in consultation with the Health GP, the CRM includes the GHS Index alongside a COVID-specific metric developed by the European Union’s Joint Research Centre INFORM initiative. The INFORM COVID Risk Index is an adaptation of the INFORM initiative’s Epidemic Risk Index – used to support prioritization of preparedness and early response actions for the primary impacts of the pandemic. The two inputs are aggregated together, with high-risk thresholds assigned by the GCRP team in consultation with Health GP.
3.3.2 Emerging Threat
| Indicator | Description | Normalization |
|---|---|---|
| IFRC Epidemics | Epidemics announced by IFRC | 10 = On list; NA = Not on list |
| WHO Disease Outbreak News (DONs) | Assigned value: 10 = if country if on WMO DON list 0 = if county not on WMO DON list |
Rationale
The primary measure of emerging health risk is provided by the WHO’s Disease Outbreak News (DONs) alerts – a real-time system providing information on all disease outbreaks notified to the WHO. Given the prominence of COVID in affecting global health system, the CRM makes use of several COVID-monitoring tools. To begin with, indicators of COVID incidence are chosen in the form of bi-weekly changes in both case counts and deaths (including numbers per 1M and growth rates). In addition to exposure, response capacities are factored in through three policy trackers provided by Oxford University’s Blavatnik School of Governance: the Government Response Index and Lockdown Rollback Index.
3.4 Macro-Fiscal
Economic shocks (and a country’s fiscal response) can have large impacts on a country’s capacity to deal with future risk as well as its development trajectory. In the context of the CRM, the macro-financial and fiscal risk dimension refers to the general status of a country’s economy and the sustainability of fiscal measures adopted. It focuses on aspects related to public sector, corporate, monetary, debt sustainability, banking and market-related risks .. Given the lack of suitable preexisting metrics for tracking underlying vulnerability and emerging threats related to macro-fiscal risk, the CRM will opt for a phased approach. The macro-fiscal dynamics dimension will first be based on a modified version of the EIU Risk Briefing score (further details on the proposed steps are outlined in Figure 1). As a second step, the CRM team will seek to replace (or complement) inputs from the EIU with an in-house metric design in collaboration with a variety of Bank units (including CROCR, MTI, FCI and Prospects). See Annex X for further details on the proposed index.
3.4.1 Underlying Vulnerability
| Indicator | Description | Normalization |
|---|---|---|
| EIU Operational Risk Score | Economist Intelligence Unit’s Country-level Operational Risk Score: a multi-dimension index tracking macro-fiscal conditions updated on a monthly basis Values are derived as an average of EIU scores for the previous 12 months (in order to be compatible with other risk dimensions) |
Normalised using a min/max procedure with an upper bound of 95 and lower bound of 10. |
| Macro-financial Vulnerabilities Country Watchlist (WB) | 10 = High 7 = Medium 0 = Moderate |
Aggregation
Use Watchlist; if no data, use DSA; if no data, use MFR Risk Rating; if no data, use EIU’s Operational Risk Score
Rationale
Few holistic measures of exposure and sensitivity to macro-fiscal shocks exist – especially considering the CRM’s need for global coverage. With that in mind, the CRM makes use of the EIU’s Operational Risk Score as an interim measure (to be supplanted by an in-house index currently under development with support from various units across the Bank). As a widely used multi-dimensional index the EIU’s Operational Risk Score (ORS) provides a regularly updated measure of macro-fiscal conditions across a range of different components. It is comprised of 70 grouped indicators across a variety of categories, including: financial risk, foreign trade & payments risk, infrastructure risk, labor market risk, legal & regulatory risk, macroeconomic risk, and tax policy risk. For the purposes of the CRM, ORS categories relating to security, political stability and government effectiveness are removed from the raw measure owing to duplication with other risk dimensions within the CRM. Unlike many alternative risk metrics (such as the WB’s Macro-Financial Review index), the ORS is global in nature, profiling risk scores across 180 countries. In order to reflect levels of underlying vulnerability, the CRM makes use a 12-month ORS average. Use of an average of prior scores provides a (relatively) static assessment of the overall status of macro-fiscal conditions. Inclusion of past values may also help smooth out some of the forward-looking elements of the EIU. This is also consistent with source indicators for underlying vulnerability across other risk dimensions in the CRM – most of which update on an annual basis.
3.4.2 Emerging Threat
| Indicator | Description | Normalization |
|---|---|---|
| IMF–World Bank Debt Sustainability Analysis Rating | 10 = High or In distress 7 = Medium 0 = Moderate |
|
| EIU Operational Risk Score | Point change in the Economist Intelligence Unit’s Country-level Operational Risk Score: a multi-dimension index tracking macro-fiscal conditions updated on a monthly basis Values are based on the difference between the latest EIU monthly score and an average of scores over the past 12 months. |
Normalised using a min/max procedure with an upper bound of the 95th percentile and a lower bound of the 10th percentile |
| Macro-financial Vulnerabilities Country Watchlist (WB) | 10 = High 7 = Medium 0 = Moderate |
Rationale
To gauge whether macro-fiscal risk conditions within a given country are worsening (or likely to worsen in the coming months) the CRM uses a point difference between the latest monthly EIU score and average scores for the previous year (excluding the current period). This provides an overview of countries where the macro-fiscal environment has recently deteriorated relative to expected conditions over the previous year. A similar measure is used by the EIU in referring to upgrades/downgrades in macro-fiscal conditions. Given the ORS updates on a monthly basis, the metric provides a regular update on the status of emerging threats. With global coverage across a range of macro-fiscal elements, use of the ORS does not require use of a hierarchy of data inputs to fill coverage gaps (as with other multi-dimensional macro-fiscal outlooks).
3.5 Natural Hazards
Natural hazards are perhaps the threat most typically associated with compound risk. They also feature prominently as core dimensions in a wide range of risk monitoring efforts, including INFORM, ND-GAIN and FAO/WFP’s Early Warning Analysis. There are many examples of back-to-back (or overlapping) hazards that have resulted in complex crisis. The short span between cyclones Kenneth and Idai in Mozambique (2019) and the more recent successive occurrence of hurricanes Eta and Iota in Nicaragua (2020) are good examples of the devastation that natural hazards can inflict on societies and economies. In the context of the CRM, we categorize natural hazards across climate-related events such as floods, droughts and cyclones; geophysical events such as earthquakes and tsunamis; as well as pest-related events such as the locust outbreak currently affecting the Horn of Africa.
3.5.1 Underlying Vulnerability
| Indicator | Description | Normalization |
|---|---|---|
| INFORM Natural multi-hazard rating | Historical rates of exposure and sensitivity to earthquake, tsunami, flood, cyclone, storm surge and drought risk. For more details see link. | Normalised using a min/max procedure with an upper bound of 7 and lower bound of 1 |
Rationale
A range of natural hazard indexes exist, providing a number of options for use in the CRM. Given the CRM’s close alignment with the INFORM Risk Index – particularly for measures of underlying vulnerability – use of INFORM’s Natural Multi-Hazard Index was considered most appropriate. The index compiles exposure and vulnerability metrics on a range of hazards including earthquakes, tsunami, drought, flood and heatwaves. In addition, the CRM makes use of extensive information on exposure from the WB’s ThinkHazard! Database. Thresholds are assigned by the GCRP team in consultation with GFDRR.
3.5.2 Emerging Threats
| Indicator | Description | Normalization |
|---|---|---|
| IRI Seasonal Forecast Index | Measure of the proportion of a country projected to experience above or below average rainfall (with 60+ likelihood and above) using Columbia IRI’s seasonal forecast. To be updated based on ongoing research and collaboration with IRI | 10 = Between 50 and 100% of country affected by above/below average rainfall 7 = Between 10 and 50% 0 = Below 10 % |
| GDACS Live Hazard Tracker | Assigned value: 10 = if ongoing Natural Hazard 0 = no ongoing Natural Hazard |
|
| INFORM Severity Natural Hazard Crisis Monitor | Normalised using a min/max procedure with an upper bound of 7 and a lower bound of 1 | |
| FAO Locust Threat | Risk of desert locust outbreak | Assigned value: 10 = High risk based on FAO thresholds 7 = Medium risk based on FAO tresholds 0 = Low risk based on FAO thresholds |
| ACAPS Risk List | 10 = High risk 7 = Medium risk 3 = Low risk |
Rationale
While there are many real-time and forecast-based tracking tools for natural hazards, few compile multi-hazard information to provide a snap-shot of emerging threats. Those that do, are often focused on specific regions (e.g. Europe and North America). Under the current iteration of the CRM, information from three mains sources is used. This includes country-level seasonal risk profiles using forecasts derived from Columbia University’s International Research Institute for Climate and Society (IRI). The forecast operates on a 2-3 month time horizons – with the CRM’s index primarily focus on above or below average precipitation. Forecasts also provide estimates of expected impacts from ENSO events. In addition to the seasonal forecast, the CRM makes use of a number of other real-time hazard trackers. This includes inputs from the EU’s Global Disaster Alert and Coordination System (GDACS), INFORM’s Natural Hazards Crisis tracker and FAO’s Desert Locust Monitor – all of which monitor the severity and impact of ongoing hazard events.
3.6 Socio-economic Vulnerability
The inclusion of socio-economic vulnerability in the CRM recognizes that compound risk arises from the interactions of hazards and underlying vulnerabilities. Indeed, a compound event can occur precisely because a community has experienced a rapid deterioration in livelihood outcomes and/or coping capacity – meaning that the ability to deal with emerging threats is severely compromised (even for threats that would otherwise not lead to crisis). To complement use of macro-level inputs, the CRM also monitors socio-economic vulnerability, leveraging the World Bank’s unique sources of real-time data on household-level dynamics – including poverty projections, inequality level estimates and remote phone-surveys.
3.6.1 Underlying Vulnerability
| Indicator | Description | Normalization |
|---|---|---|
| INFORM Socio-economic Vulnerability Index | Composite index comprised of a range of socio-economic variables compiled by INFORM. Comprised of grouped indicators relating to: development and deprivation (50%); inequality (25%) and economic dependence (25%). | Normalised using a min/max procedure with an upper bound of 7 and lower bound of 0 |
Rationale
As with many of the compound risk dimensions, socio-economic vulnerability is a multi-dimensional concept. It’s inclusion in the CRM recognises that compounding events are a product not only of exposure to consecutive (or overlapping) hazards, but the ability of people and communities to cope with and respond to emerging threats. Severe heightening of socio-economic vulnerabilities can often lead to compounding events, even in cases where exposure to mild overlapping threats would otherwise not lead to a disaster. With that in mind, the CRM currently makes use of the INFORM’s Socio-Economic Vulnerability Index as a composite measure comprised of traits related to deprivation, inequality, dependency, uprootedness and composition of vulnerable groups.
3.6.2 Emerging Threat
| Indicator | Description | Normalization |
|---|---|---|
| Unemployment Rate | Percentage point change in proportion of people unemployed between 2022-2021 and 2021-2020 (IMF forecast) | Normalised using a min/max procedure with an upper bound of 1 and lower bound of 0 |
| MFRI Household Risk Level | Assigned values 10 = MFRI of 1 7 = MFRI of 0.5 0 = MFRI of 0 |
|
| People Below Poverty Line | Percentage point change in the proportion of people below $2.05 poverty line between 2022-2021 and 2021-2020 (WB/MPO) | Normalised using a min/max procedure with an upper bound of 0.5 percentage points and a lower bound of 0 |
| ACAPS Risk List | Events related to socioeconomic vulnerability recorded by ACAPS | 10 = High risk 7 = Medium risk 3 = Low risk |
Rationale
Finding real-time global measures of socio-economic vulnerability is a considerable challenge – particularly those that reflect household-level conditions and coping capacities. In consulting widely with the WB’s Prospects team, Poverty and Equity GP and Development Data Group, the CRM currently comprises a basket of indicators. The first metric is country-level poverty projections. Figures are taken from the World Bank’s Macro Poverty Outlook (MPO), with forecasted percentage point differences in the proportion of people living below $1.90 chosen as a proxy for deteriorating household-level coping capacities. Percentage point differences for both 2021-2020 and 20210-2019 are used in the current iteration, recognising that the knock-on implications of increased poverty on household-level vulnerability can persist for long periods of time. In addition to poverty, inclusion of unemployment forecasts is included to factor future changes in labour conditions and livelihood opportunities using the IMF’s World Economic Outlook. As with GDP inputs, percentage point differences for both 2021-2020 and 2020-2019 are used (for the same reasons). Alongside this, the CRM uses MFRI’s composite measure of household-level risk (made up of changes to household debt-to-GDP ratios and unemployment rates during the previous quarter). Lastly, the CRM makes use of a wealth of information gathered through the ongoing COVID phone surveys. In consultation with the Poverty and Equity GP, a prototype index is added compiling information from a selection of relevant questions included in the phone surveys. Thresholds for each indicator are assigned in consultation with the Prospects team, Poverty and Equity GP and Development Data Group.